Wheel is a first-party original game developed by Stake and Stake.us that has spawned comparable games on countless other social casinos.
It is reminiscent of the prize wheels seen on Price Is Right, Wheel of Fortunate and thousands of giveaway and prize events throughout the world. You set your bet amount, the risk level (Low, Medium, High) and segment count (10, 20, 30, 40, 50). From there the game is out of your control. Just click and watch it spin, hoping to land on a winning segment that will award a multiplier between 1.2x and 49.50x depending on your wheel’s configuration.
Basic Odds of Winning
As with any casino game, there exists an inherit house advantage. The specifics vary depending on what risk level and segment count you indicate.
- On low risk, you have a 20% chance of losing your full bet amount.
- On medium risk, you have a 50% chance of losing your full bet amount.
- On high risk, you have a 90-98% chance of losing your full bet amount.
I have created a table that includes the win/loss odds across all risk levels and segment counts. It includes the total multiplier count and the outcomes when assuming a 1.00 bet. You can sort and filter the columns any way you’d like.
| Risk | Segments | Multiplier | Chance | Percent | Bet | Win | Net |
|---|---|---|---|---|---|---|---|
| 3 – High | 50 | 49.50 | 1 | 2.00% | 1.00 | 49.50 | 48.50 |
| 3 – High | 40 | 39.60 | 1 | 2.50% | 1.00 | 39.60 | 38.60 |
| 3 – High | 30 | 29.70 | 1 | 3.33% | 1.00 | 29.70 | 28.70 |
| 3 – High | 20 | 19.80 | 1 | 5.00% | 1.00 | 19.80 | 18.80 |
| 3 – High | 10 | 9.90 | 1 | 10.00% | 1.00 | 9.90 | 8.90 |
| 2 – Medium | 50 | 5.00 | 1 | 2.00% | 1.00 | 5.00 | 4.00 |
| 2 – Medium | 30 | 4.00 | 1 | 3.33% | 1.00 | 4.00 | 3.00 |
| 2 – Medium | 10 | 3.00 | 1 | 10.00% | 1.00 | 3.00 | 2.00 |
| 2 – Medium | 20 | 3.00 | 1 | 5.00% | 1.00 | 3.00 | 2.00 |
| 2 – Medium | 30 | 3.00 | 1 | 3.33% | 1.00 | 3.00 | 2.00 |
| 2 – Medium | 40 | 3.00 | 4 | 10.00% | 1.00 | 3.00 | 2.00 |
| 2 – Medium | 50 | 3.00 | 3 | 6.00% | 1.00 | 3.00 | 2.00 |
| 2 – Medium | 10 | 2.00 | 2 | 20.00% | 1.00 | 2.00 | 1.00 |
| 2 – Medium | 20 | 2.00 | 6 | 30.00% | 1.00 | 2.00 | 1.00 |
| 2 – Medium | 30 | 2.00 | 6 | 20.00% | 1.00 | 2.00 | 1.00 |
| 2 – Medium | 40 | 2.00 | 7 | 17.50% | 1.00 | 2.00 | 1.00 |
| 2 – Medium | 50 | 2.00 | 8 | 16.00% | 1.00 | 2.00 | 1.00 |
| 2 – Medium | 10 | 1.90 | 1 | 10.00% | 1.00 | 1.90 | 0.90 |
| 2 – Medium | 20 | 1.80 | 1 | 5.00% | 1.00 | 1.80 | 0.80 |
| 2 – Medium | 30 | 1.70 | 1 | 3.33% | 1.00 | 1.70 | 0.70 |
| 2 – Medium | 40 | 1.60 | 1 | 2.50% | 1.00 | 1.60 | 0.60 |
| 1 – Low | 10 | 1.50 | 1 | 10.00% | 1.00 | 1.50 | 0.50 |
| 1 – Low | 20 | 1.50 | 2 | 10.00% | 1.00 | 1.50 | 0.50 |
| 1 – Low | 30 | 1.50 | 3 | 10.00% | 1.00 | 1.50 | 0.50 |
| 1 – Low | 40 | 1.50 | 4 | 10.00% | 1.00 | 1.50 | 0.50 |
| 1 – Low | 50 | 1.50 | 5 | 10.00% | 1.00 | 1.50 | 0.50 |
| 2 – Medium | 10 | 1.50 | 2 | 20.00% | 1.00 | 1.50 | 0.50 |
| 2 – Medium | 20 | 1.50 | 2 | 10.00% | 1.00 | 1.50 | 0.50 |
| 2 – Medium | 30 | 1.50 | 6 | 20.00% | 1.00 | 1.50 | 0.50 |
| 2 – Medium | 40 | 1.50 | 8 | 20.00% | 1.00 | 1.50 | 0.50 |
| 2 – Medium | 50 | 1.50 | 13 | 26.00% | 1.00 | 1.50 | 0.50 |
| 1 – Low | 10 | 1.20 | 7 | 70.00% | 1.00 | 1.20 | 0.20 |
| 1 – Low | 20 | 1.20 | 14 | 70.00% | 1.00 | 1.20 | 0.20 |
| 1 – Low | 30 | 1.20 | 21 | 70.00% | 1.00 | 1.20 | 0.20 |
| 1 – Low | 40 | 1.20 | 28 | 70.00% | 1.00 | 1.20 | 0.20 |
| 1 – Low | 50 | 1.20 | 35 | 70.00% | 1.00 | 1.20 | 0.20 |
| 1 – Low | 10 | 0.00 | 2 | 20.00% | 1.00 | 0.00 | -1.00 |
| 1 – Low | 20 | 0.00 | 4 | 20.00% | 1.00 | 0.00 | -1.00 |
| 1 – Low | 30 | 0.00 | 6 | 20.00% | 1.00 | 0.00 | -1.00 |
| 1 – Low | 40 | 0.00 | 8 | 20.00% | 1.00 | 0.00 | -1.00 |
| 1 – Low | 50 | 0.00 | 10 | 20.00% | 1.00 | 0.00 | -1.00 |
| 2 – Medium | 10 | 0.00 | 5 | 50.00% | 1.00 | 0.00 | -1.00 |
| 2 – Medium | 20 | 0.00 | 10 | 50.00% | 1.00 | 0.00 | -1.00 |
| 2 – Medium | 30 | 0.00 | 15 | 50.00% | 1.00 | 0.00 | -1.00 |
| 2 – Medium | 40 | 0.00 | 20 | 50.00% | 1.00 | 0.00 | -1.00 |
| 2 – Medium | 50 | 0.00 | 25 | 50.00% | 1.00 | 0.00 | -1.00 |
| 3 – High | 10 | 0.00 | 9 | 90.00% | 1.00 | 0.00 | -1.00 |
| 3 – High | 20 | 0.00 | 19 | 95.00% | 1.00 | 0.00 | -1.00 |
| 3 – High | 30 | 0.00 | 29 | 96.67% | 1.00 | 0.00 | -1.00 |
| 3 – High | 40 | 0.00 | 39 | 97.50% | 1.00 | 0.00 | -1.00 |
| 3 – High | 50 | 0.00 | 49 | 98.00% | 1.00 | 0.00 | -1.00 |
We can see from the figures that on low risk, where you stand to win 80% of the time, the actual win amount will be $0.20 to $0.50 on every dollar per spin. Mathematically, my wizard assistant indicates the expected value (EV) on low risk is 0.79W and the house advantage is 21%. On medium at 10 segments, the EV decreases to 0.39W and the house advantage sits at 61%. On high at 10 segments, the EV drops to 0.01W and the house advantage sits at 99%.
Stepping back and we can see the house advantage most easily with the high risk options. Theoretically with 10 segments a user stands to hit the single win segment 10% of the time, or 1 out of every 10 spins in the long run. But winning every 10th spin will cost you $10 while netting you only $8.90. Of course there will be many runs where you may go 20, 30, 40 or more spins without hitting that win segment a single time and some instances where you might get several consecutive wins.
What About the Win/Loss Streaks?
Let me preface this experiment by pointing out the obvious; each spin is entirely independent of the other. It is easy to run into a gambler’s fallacy (“erroneously believing that a certain random event is less likely or more likely to happen based on the outcome of a previous event or series of events“) by attempting to find patterns.
If you spin the wheel hundreds of thousands of times you will eventually see anomalies that appear to defy the laws of probability. This is no different than a coin toss where you end up flipping heads 5, 10 even 15 times consecutively. Done over enough time, crazy win or loss streaks will still appear regardless of how exceedingly rare they are.
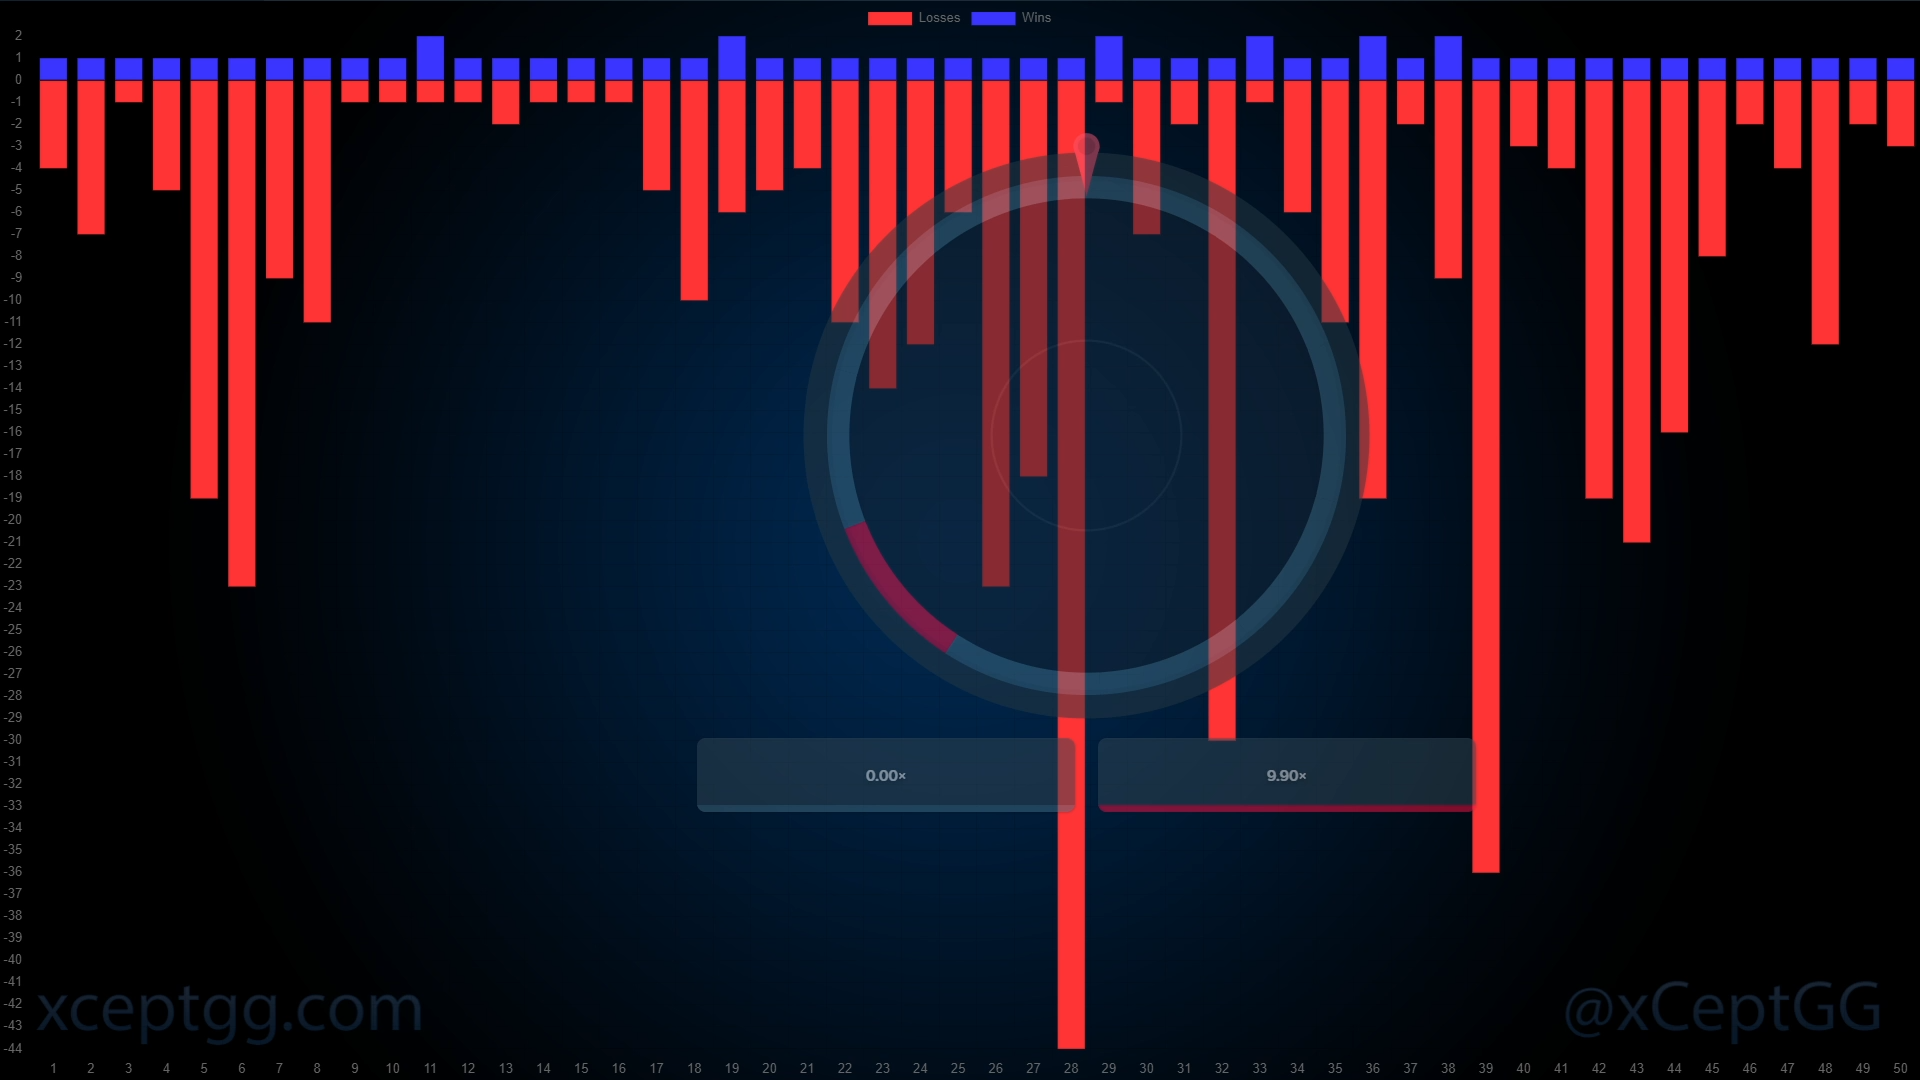
That said, I was curious to see the maximum win or loss streaks that may occur in a sampling of more than 55,000 runs. So I worked up a little graph to track the wins and losses in real-time. For this initial experiment, I went with High Risk 10 Segments.
The rules are simple: I consider each LOSS-WIN sequence to be a single round. Within each round, I track how many sequential losses occur and then how many sequential wins occur, and when the next loss arrives I close out the previous round and tally up the streaks.
Graphing 5,000+ Win/Loss Rounds
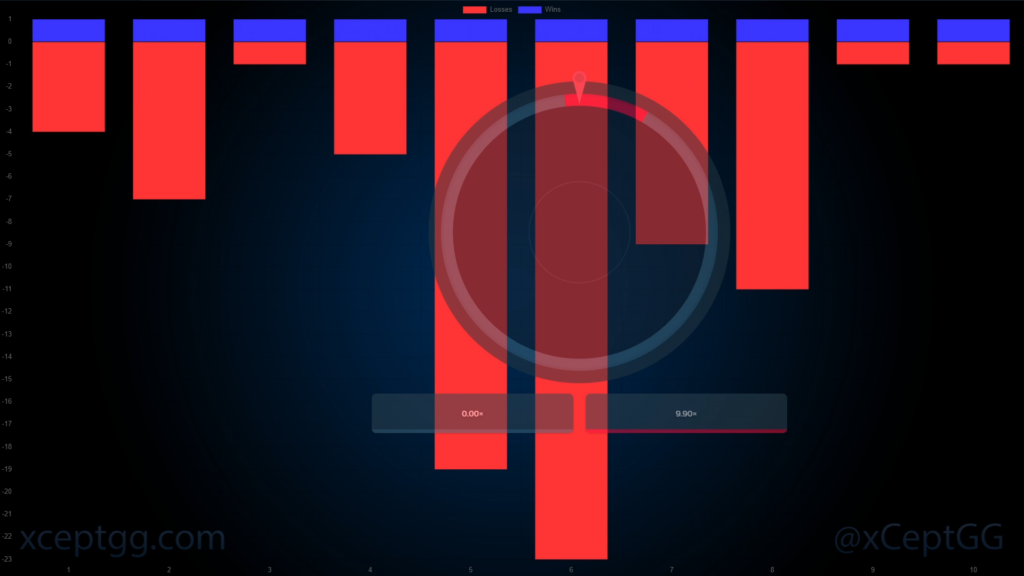
After 10 completed rounds the graph appeared as above. The left axis indicates the total streak count and the bottom access indicates the round number. Round 1 saw 4 losses followed by a single win. The loss streaks were as few as 1 and as many as 23, while wins were consistently just 1 as expected when the odds are only 10% for hitting it. But this is a miniscule sample size, let’s continue.
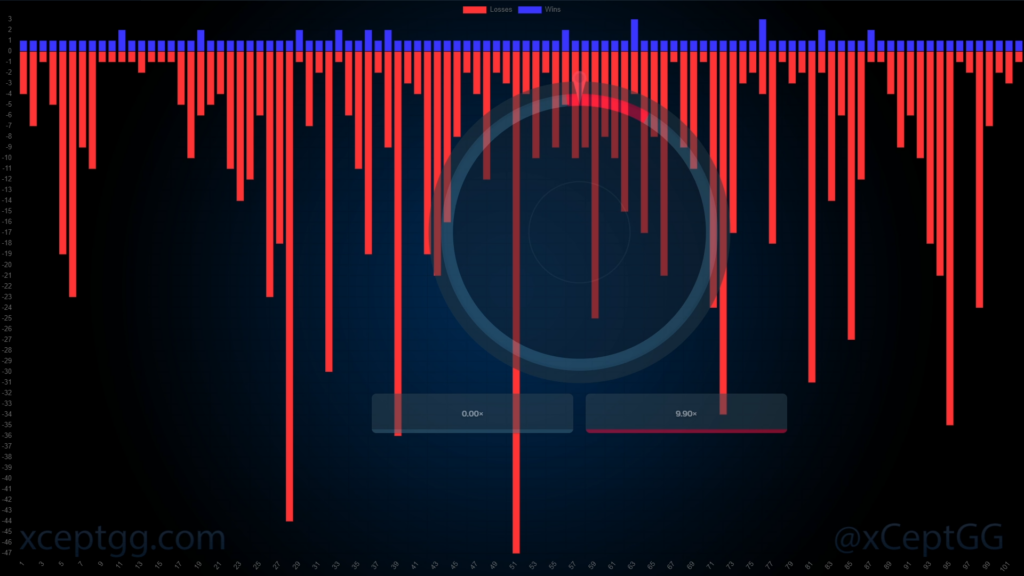
At 100 completed rounds of loss-win cycles, a few more observations can be seen. The vast majority of wins are singular, with only 11 of the 100 rounds resulting in a double win and 3 resulting in a triple. At the same time, it is not particularly uncommon to see dozens of losses in a row, here stooping all the way down to a 47 loss streak!
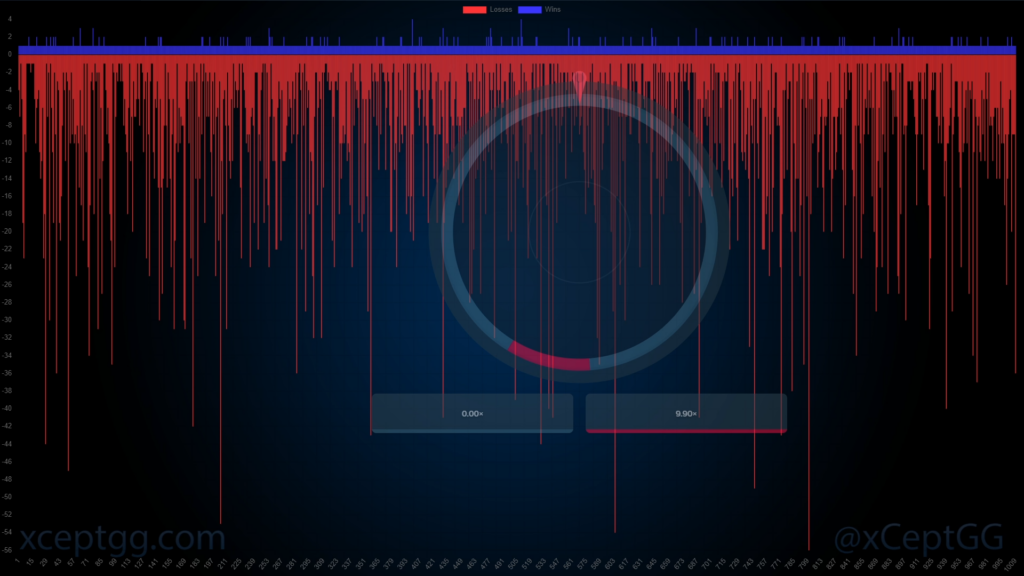
Now at more than 1,000 rounds of consecutive losses and wins, there have been several loss streaks that exceed 50 and a couple 4-in-a-row win streaks. The lines are getting thin by this point in the image, which allows us to more easily see most frequent occurrences across the full span of rounds. Visually, the density starts diminishes heavily by the mid-20s of consecutive losses. With only a dozen or so loss sequences reaching beyond the 40 point.
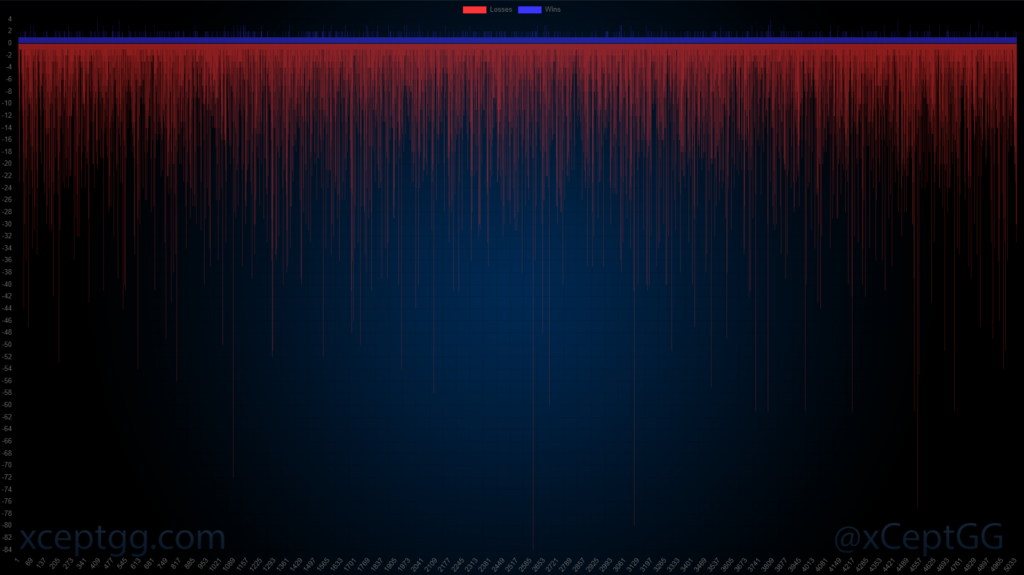
10 hours later… More than 5,033 complete rounds have been graphed with a combined total of 54,743 spins. 5,581 spins were wins (10.19491076484665%), and 49,162 were losses (89.80508923515335%).
Through all of this, there were more than a dozen instances where the loss streaks exceeded 50 rounds and four instances where it exceeded 60-70. One run produced 84 losses in a row.
Additional Observations
What does this tell us? Well… Attempting a martingale-style strategy of doubling your bet on each loss would rapidly turn catastrophic on high risk. Even using the most conservative multiplier possible and $0.01 starting bet could land you in a four digit net loss quickly. Running one with a 1.5x or higher would exceed a million dollars by round 77!
We can also surmise that running this test for another 50,000 spins would inevitably yield additional 80+ and even 90-100+ sequences of losses, though they would still be far and few in between the most common 5-20 falloff spectrum. Still, they will happen.
If you were attempting to martingale high risk knowing this potential of failure, the safest bet would be to run through at last 40-60 sequential losses in a row before betting a single penny and then multiply it by the least amount needed to recoup losses based on the 9.9x return. You would want to work with a very low multiplier, say 1.05 to 1.125, to maximize the number of losses you could handle before going broke. But the lower the multiplier on loss, the smaller the gains will be even after major dips following lengthy consecutive losses.
There are more interesting potential strategies and betting approaches if we consider the medium risk variants instead. Those include a variety of multipliers in ways that I feel could produce more reasonable gains and lower losses…but that’s for another article!
Leave a Reply